2009-2010 Influenza Season Week 49 ending December 12, 2009
All data are preliminary and may change as more reports are received.
Synopsis:
During week 49 (December 6-12, 2009), influenza activity continued to decrease in the U.S.
- 391 (6.9%) specimens tested by U.S. World Health Organization (WHO) and National Respiratory and Enteric Virus Surveillance System (NREVSS) collaborating laboratories and reported to CDC/Influenza Division were positive for influenza.
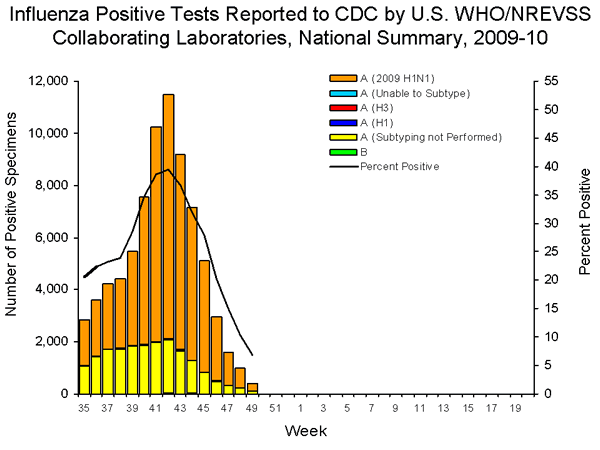
- Over 99% of all subtyped influenza A viruses being reported to CDC were 2009 influenza A (H1N1) viruses.
- The proportion of deaths attributed to pneumonia and influenza (P&I) was above the epidemic threshold for the eleventh consecutive week.
- Nine influenza-associated pediatric deaths were reported. Eight of these deaths were associated with 2009 influenza A (H1N1) virus infection and one was associated with an influenza A virus for which the subtype was undetermined.
- The proportion of outpatient visits for influenza-like illness (ILI) was 2.6% which is above the national baseline of 2.3%. Five of the 10 regions reported ILI at or above region-specific baseline levels. Regions 3, 6, 7, 8 and 10 reported ILI below their region specific baselines.
- Eleven states reported geographically widespread influenza activity, 20 states reported regional influenza activity, the District of Columbia, Puerto Rico, and 11 states reported local influenza activity, the U.S. Virgin Islands and eight states reported sporadic influenza activity, and Guam reported no influenza activity.
| HHS Surveillance Regions* | Data for current week | Data cumulative since August 30, 2009 (Week 35)* | ||||||||
|---|---|---|---|---|---|---|---|---|---|---|
| Out-patient ILI† | % positive for flu‡ | Number of jurisdictions reporting regional or widespread activity§ | A (H1) | A (H3) | 2009 A (H1N1) | A (unable to sub-type)¥ | A(Subtyping not performed) | B | Pediatric Deaths | |
| Nation | Elevated | 6.9 % | 31 of 54 | 26 | 46 | 58,381 | 309 | 18,330 | 190 | 212 |
| Region 1 | Elevated | 18.2 % | 5 of 6 | 5 | 2 | 3,213 | 14 | 459 | 10 | 5 |
| Region 2 | Elevated | 13.6 % | 2 of 4 | 2 | 4 | 1,201 | 0 | 1,039 | 4 | 6 |
| Region 3 | Normal | 9.8 % | 3 of 6 | 3 | 7 | 10,441 | 45 | 1,428 | 15 | 12 |
| Region 4 | Elevated | 11.1 % | 7 of 8 | 0 | 4 | 6,432 | 88 | 4,009 | 50 | 41 |
| Region 5 | Elevated | 14.7 % | 3 of 6 | 6 | 19 | 9,058 | 56 | 1,287 | 11 | 28 |
| Region 6 | Normal | 3.5 % | 3 of 5 | 0 | 3 | 3,192 | 43 | 4,432 | 37 | 63 |
| Region 7 | Normal | 6.2 % | 1 of 4 | 3 | 1 | 3,252 | 3 | 752 | 3 | 5 |
| Region 8 | Normal | 9.5 % | 1 of 6 | 5 | 2 | 9,575 | 0 | 3,667 | 50 | 13 |
| Region 9 | Elevated | 15.2 % | 4 of 5 | 0 | 3 | 7,937 | 47 | 1,085 | 8 | 30 |
| Region 10 | Normal | 21.6 % | 2 of 4 | 2 | 1 | 4,080 | 13 | 172 | 2 | 9 |
*Influenza season officially begins each year at week 40. This season data from week 35 will be included to show the trend of influenza activity before the official start of the 2009-10 influenza season.
**HHS regions (Region 1 CT, ME, MA, NH, RI, VT; Region 2: NJ, NY, Puerto Rico, US Virgin Islands; Region 3: DE, DC, MD, PA, VA, WV; Region 4: AL, FL, GA, KY, MS, NC, SC, TN; Region 5: IL, IN, MI, MN, OH, WI; Region 6: AR, LA, NM, OK, TX; Region 7: IA, KS, MO, NE; Region 8: CO, MT, ND, SD, UT, WY; Region 9: AZ, CA, Guam, HI, NV; and Region 10: AK, ID, OR, WA).
† Elevated means the % of visits for ILI is at or above the national or region-specific baseline
‡ National data are for current week; regional data are for the most recent three weeks
§ Includes all 50 states, the District of Columbia, Guam, Puerto Rico, and U.S. Virgin Islands
¥ Subtyping results for the majority of specimens in this category were inconclusive because of low virus titers.
U.S. Virologic Surveillance:
WHO and NREVSS collaborating laboratories located in all 50 states and Washington D.C., report to CDC the number of respiratory specimens tested for influenza and the number positive by influenza type and subtype. The results of tests performed during the current week are summarized in the table below.
| Week 49 | |
|---|---|
| No. of specimens tested | 5,640 |
| No. of positive specimens (%) | 391 (6.9%) |
| Positive specimens by type/subtype | |
| Influenza A | 389 (99.5%) |
| A (2009 H1N1) | 273 (70.2%) |
| A (subtyping not performed) | 108 (27.8%) |
| A (unable to subtype)* | 6 (1.5%) |
| A (H3) | 2 (0.5%) |
| A (H1) | 0 (0.0%) |
| Influenza B | 2 (0.5%) |
*Subtyping results for five of the six specimens in this category were inconclusive because of low virus titers, and additional testing is pending for one specimen.
During week 49, seasonal influenza A (H3N2) and influenza B viruses co-circulated at low levels with 2009 influenza A (H1N1) viruses. Over 99% of all subtyped influenza A viruses reported to CDC this week were 2009 influenza A (H1N1) viruses.
View WHO-NREVSS Regional Bar Charts | View Chart Data | View Full Screen | View PowerPoint Presentation
Pneumonia and Influenza Hospitalization and Death Tracking:
This new system was implemented on August 30, 2009, and replaces the weekly report of laboratory confirmed 2009 H1N1-related hospitalizations and deaths that began in April 2009. Jurisdictions can now report to CDC counts of hospitalizations and deaths resulting from all types or subtypes of influenza, not just those from 2009 H1N1 influenza virus. To allow jurisdictions to implement the new case definition, counts were reset to zero on August 30, 2009. From August 30 – December 12, 2009, 35,309 laboratory-confirmed influenza-associated hospitalizations and 1,567 laboratory-confirmed influenza-associated deaths were reported to CDC. CDC will continue to use its traditional surveillance systems to track the progress of the 2009-10 influenza season.

No comments:
Post a Comment